

GAMP Services Limited
  • Our Company
    • About Us
    • Contact Us
  • Services
    • Thermal Validation
    • Commissioning, Qualification & Validation
    • Clean Room Validation
    • Computer System Validation & Data Integrity
    • Bio-Decontamination
  • Manufacturing
    • Data Logger
  • Industries
    • Life Science
    • Pharmaceutical
    • Medical Devices
    • Food & Beverages
    • OEM, Testing & Third-party Validators
    • High-Tech
    • Semiconductor
    • Electrical, Electronics & Mobile
    • Aerospace & Defence
    • Automobile, EV, Battery & Renewables
  • Distribution
    • Thermal Validation
    • Cleanroom Monitoring
    • Biodecontamination
    • Tracer Particle Generator
    • Process Analytical Tools (PAT)
  • Resources
    • News
    • Knowledge Centre
  • Investor Relations
    • Governance
    • Board of Directors
    • Key Managerial Personnel (KMP)
    • Composition of Committees
    • Policies
    • Our Group
    • Our Subsidiaries
    • Group Companies
    • Disclosures
    • Annual Report
    • Annual Return
    • Memorandum of Association (MOA)
    • Articles of Association (AOA)
    • Public Offer
    • IPO
    • Offer Documents
Knowledge Centre
Knowledge Centre
  1. Home
  2. Knowledge Centre
  3. Blogs
  4. Mapping a warehouse: where the sensors go, and for how long
Thermal Validation

Mapping a warehouse: where the sensors go, and for how long

A mapping study is only as good as its plan. Grid spacing, heights, duration and the summer-versus-winter question.

Pritam Thakor 4 Sep 2026 3 min read
Mapping a warehouse: where the sensors go, and for how long
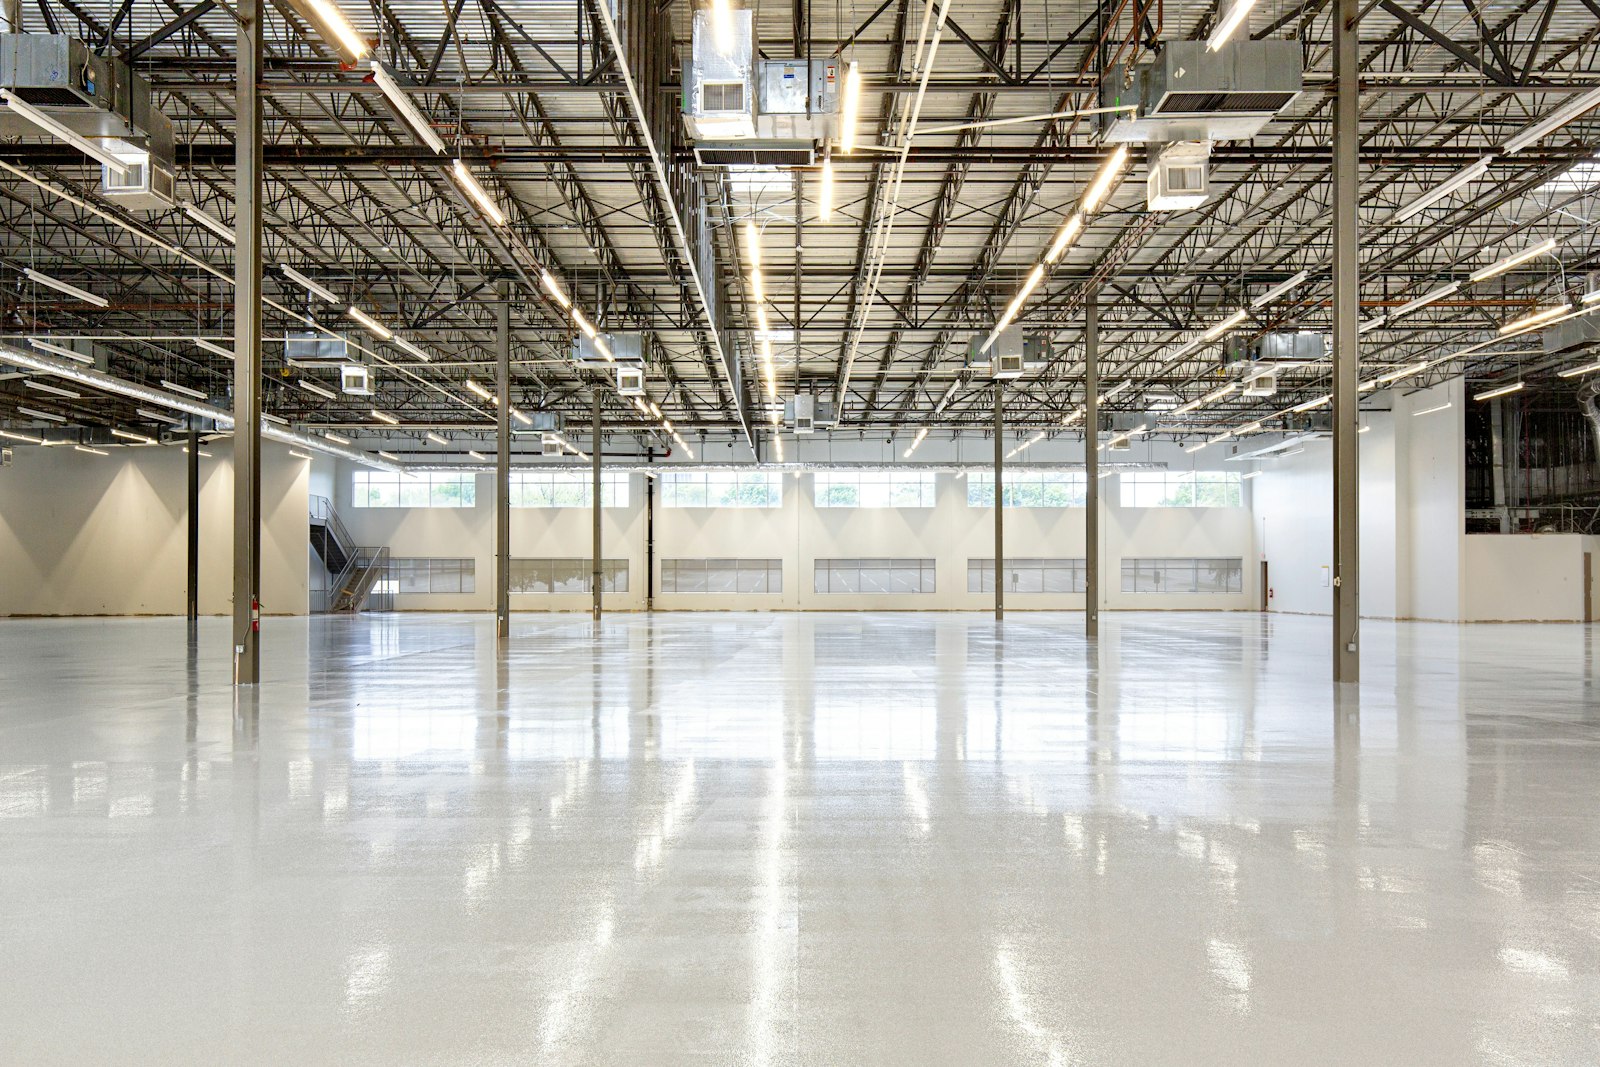
Photo: Craftsman Concrete Floors on Unsplash
On this page The guidance most people use Laying out the sensors How long, and when Choosing the loggers What the report should give you When to map again
Related service Thermal Validation Learn more

A warehouse looks uniform from the doorway. Racks, a concrete floor, an HVAC unit humming somewhere above. The temperature inside it is anything but uniform. The top shelf under a metal roof in May, the pallet next to the loading dock, the corner the air handling never quite reaches: these are the places where product actually sits outside its label conditions, and a mapping study exists to find them.

Most of the work in a good mapping study happens before a single logger is switched on.

The guidance most people use

WHO Technical Report Series 961, Annex 9, Supplement 8, on temperature mapping of storage areas, is the most practical reference and is widely used beyond WHO-prequalified products. National GDP guidelines say much the same in fewer words. The recommendations below follow it.

Laying out the sensors

Start with a scaled drawing of the space, showing racks, doors, windows, HVAC supply and return points, lights and anything that produces heat. Then:

  • Place sensors in a grid across the length and width of the area. For large open spaces, spacing of 5 to 10 metres is typical. Smaller rooms need closer spacing.
  • In racked areas, place sensors at three heights: near the floor, at mid-height and at the top storage level. Warm air stratifies, and the top shelf is often the problem.
  • Add sensors at known risk points: near doors and docks, below roof lights, beside external walls, close to supply air outlets and in dead corners.
  • Put at least one sensor outside the area to record ambient conditions, so you can explain what you see inside.

Mark every position on the drawing with a unique number before the study, and photograph each logger in place. It sounds tedious until someone asks, eight months later, where logger 23 was.

How long, and when

The study should run for at least seven consecutive days, so it captures a full weekly cycle, including weekends when doors stay shut and the HVAC may behave differently. Record at a fixed interval, commonly every 5 to 15 minutes.

If the building is affected by outside weather, which most are, map in the hottest and the coldest seasons. A summer study tells you nothing about the north wall in January.

Don't skip the empty mapWhere possible, map once with the area empty or lightly loaded and once in normal operation. The empty map shows what the HVAC can do. The loaded map shows what actually happens to the product.

Choosing the loggers

Data loggers should have a calibration traceable to national standards, at points that cover the range being mapped. An accuracy of ±0.5 °C is the usual expectation for controlled room temperature storage. Check the calibration date before the study and verify the loggers after it, so a drifted unit can be identified.

What the report should give you

  • Minimum, maximum and mean temperature for every sensor, with the time of each extreme.
  • The hot and cold spots, shown on the drawing.
  • Any excursions outside the storage limits, with the likely cause.
  • Recommendations for where the permanent monitoring probes should go, usually at or near the worst-case points found.
  • Any areas that should not be used for storage, or only with restrictions.

When to map again

Remap after changes that could alter the temperature profile: new racking, a change to the HVAC, a new roof, a change in how the space is used. Many sites also remap on a fixed interval, often every two to three years, even without a change, because buildings and equipment age quietly.

The mapping report is not the end product. The end product is a set of monitoring probe positions and storage rules that you can defend, and a warehouse team that knows which shelves to keep the sensitive stock off.

PT Written by Pritam Thakor, GAMP Services Limited.
Keep reading

Related articles

View all
Steam sterilizer validation: Bowie-Dick, heat distribution and heat penetration Thermal Validation 9 Oct 20264 min read Steam sterilizer validation: Bowie-Dick, heat distribution and heat penetration What each test on a porous-load autoclave tells you, and the mistakes that send a qualification back for a repeat. Read more Continuous particle monitoring in Grade A after the 2022 Annex 1 Environmental Monitoring 14 Oct 20264 min read Continuous particle monitoring in Grade A after the 2022 Annex 1 Where the probes go, how alarms should be set and what to do with the 5 µm channel now that Annex 1 is in force. Read more ISO 14644-1 classification: how many sampling locations does your room need? Clean Room Validation 5 Oct 20263 min read ISO 14644-1 classification: how many sampling locations does your room need? The 2015 revision replaced the square-root rule with a look-up table. Here is how to use it without over- or under-sampling. Read more

Talk to our team

Talk to us about your next validation or monitoring project.

Contact Us LinkedIn

Our Business

  • Services
  • Manufacturing
  • Distribution
  • Industries

Services

  • Thermal Validation
  • Commissioning, Qualification & Validation
  • Clean Room Validation
  • Computer System Validation & Data Integrity
  • Bio-Decontamination

Company

  • About Us
  • Investor Relations
  • News
  • Knowledge Centre
  • Contact Us
copyrightGAMP Services Limited 2026. All Rights Reserved.
Privacy Policy Terms of Use