

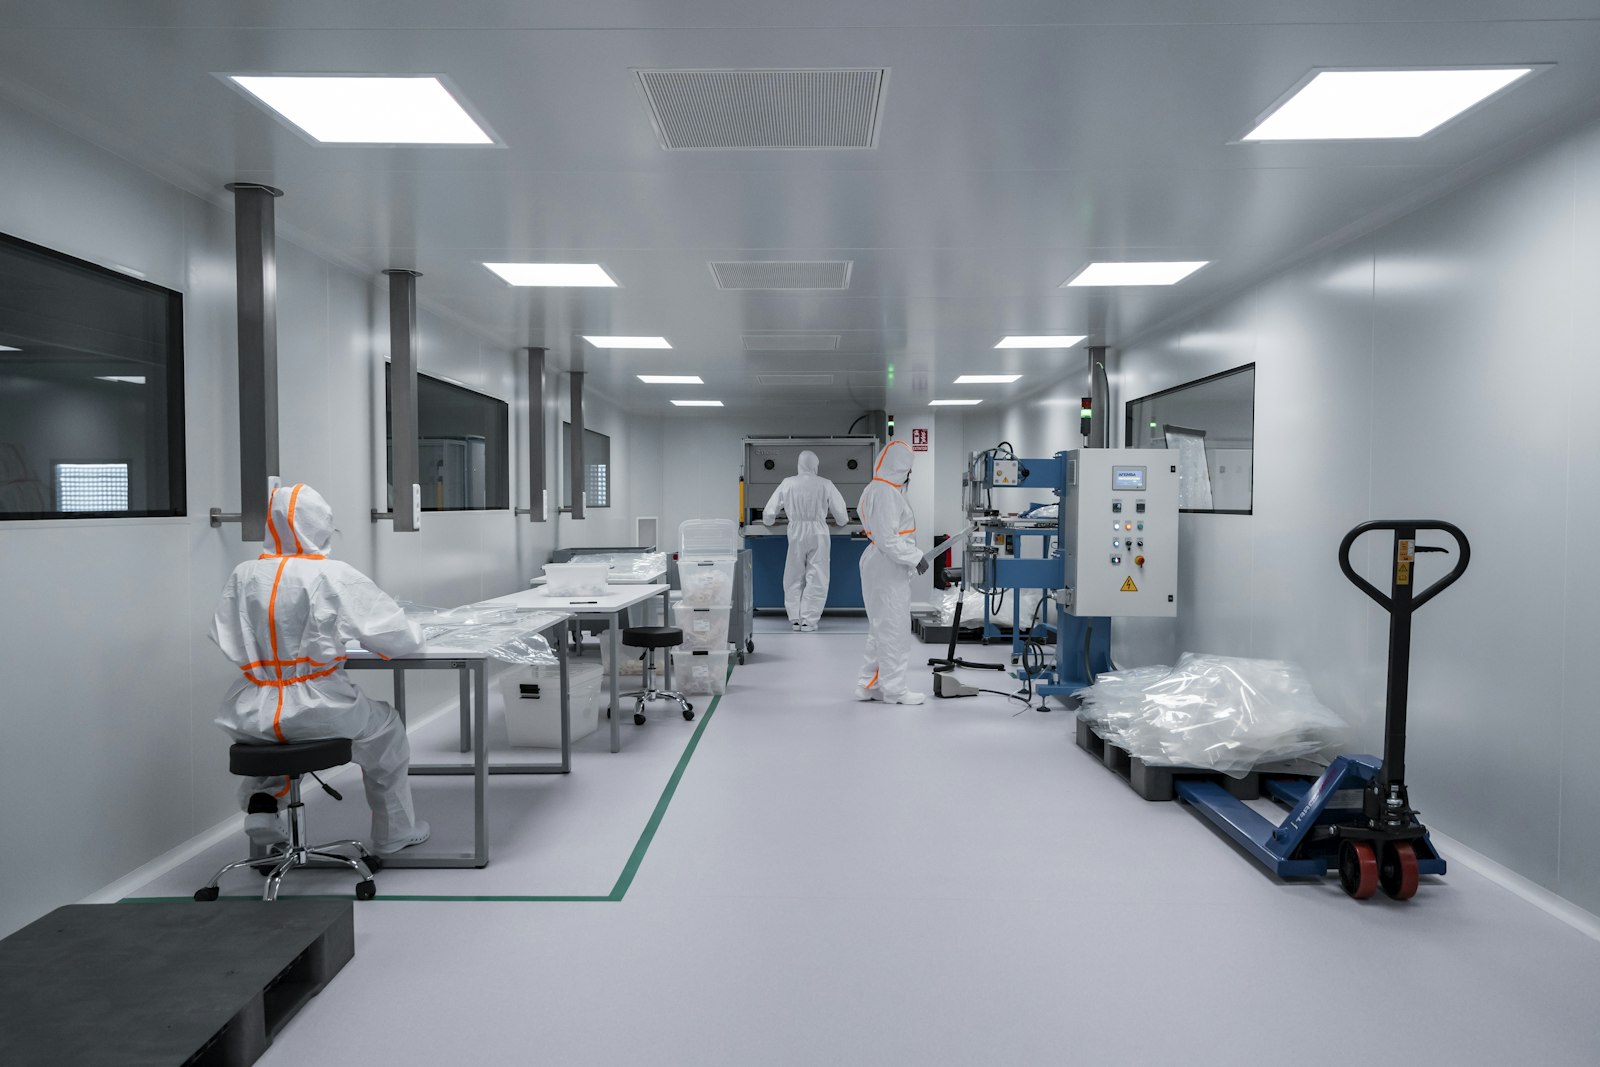
Before 2015, the number of sampling locations for a cleanroom classification was the square root of the floor area in square metres, rounded up. It was easy to remember and easy to apply. The 2015 revision of ISO 14644-1 replaced it with a look-up table in Annex A, and the numbers it gives are noticeably higher for small and medium rooms. Several years on, we still see protocols written to the old rule.
This note covers how the current method works and the decisions you still have to make yourself.
Reading Table A.1
Table A.1 gives a minimum number of sampling locations for each range of cleanroom area. A few points from the table give a feel for it:
| Area up to (m²) | Minimum locations |
|---|---|
| 2 | 1 |
| 10 | 5 |
| 24 | 6 |
| 52 | 10 |
| 104 | 16 |
| 232 | 22 |
| 1,000 | 27 |
Above 1,000 m², the standard gives a formula: the number of locations is 27 multiplied by the area divided by 1,000, rounded up.
Take a 40 m² room. The old square-root rule gave 7 locations. The table gives 10. For a 100 m² room it is 10 under the old rule and 16 now. The table was built on a statistical basis so that, with 95 % confidence, at least 90 % of the room meets the class limit. That is why the old 95 % upper confidence limit calculation is gone: the extra locations do that job instead.
Placing the locations
The standard asks you to divide the room into sections of equal area, as many as the number of locations, and to put one sampling point in each section at work height. The point should be representative of the section, which in practice usually means near its centre.
The minimum is a minimum. You can, and often should, add locations where the risk is higher: close to critical work zones, near doors, or where the airflow study shows weaker sweeping. Extra locations should be listed in the protocol with the reason, so it is clear they were planned rather than added after a bad result.
How much air to sample at each point
The single sample volume at each location has to be large enough to expect at least 20 particles if the concentration were exactly at the class limit for the largest particle size you are classifying. The formula is:
Vs = (20 / Cn,m) × 1000 litres
where Cn,m is the class limit in particles per cubic metre for that size. The volume must also be at least 2 litres, and each sample must last at least one minute.
For ISO 5 at 0.5 µm, the limit is 3,520 per m³, which gives about 5.7 litres. A counter running at 28.3 L/min covers that in a minute. If you also classify at 5 µm in an ISO 7 room, the limit is 2,930 per m³ and the volume works out to about 6.8 litres, still within a minute at 28.3 L/min. Where the numbers get large is when someone decides to classify an ISO 5 zone at 5 µm. The 2015 standard deliberately leaves that out, because the counts are too low to be statistically meaningful.
Pass or fail
Each location's average concentration must not exceed the class limit for each particle size considered. If one location fails, the room fails, unless you can show the result came from a procedural error or equipment fault. In that case the standard allows you to investigate, document the cause and repeat the sample at that location. It does not allow re-sampling until a pass appears.
Gaps we often find in protocols
- Location counts still calculated with the square-root rule.
- Locations bunched along the walls, where the counter is easy to place, rather than one per section.
- No statement of the occupancy state (as-built, at-rest or operational) being classified.
- Sample volume worked out for the wrong particle size.
- Particle counter calibration certificate out of date, or not to ISO 21501-4.
Getting these right is mostly a matter of doing the arithmetic in the protocol, where a reviewer can check it, instead of leaving it to the day of the test.


 GAMP Services Limited 2026. All Rights Reserved.